The WordPress debug log is a new feature in the CSDN plugin since version 1.0.15. It logs the site’s PHP errors into its own file, without touching wp-config.php. You switch it on from the backend, and it switches itself off.
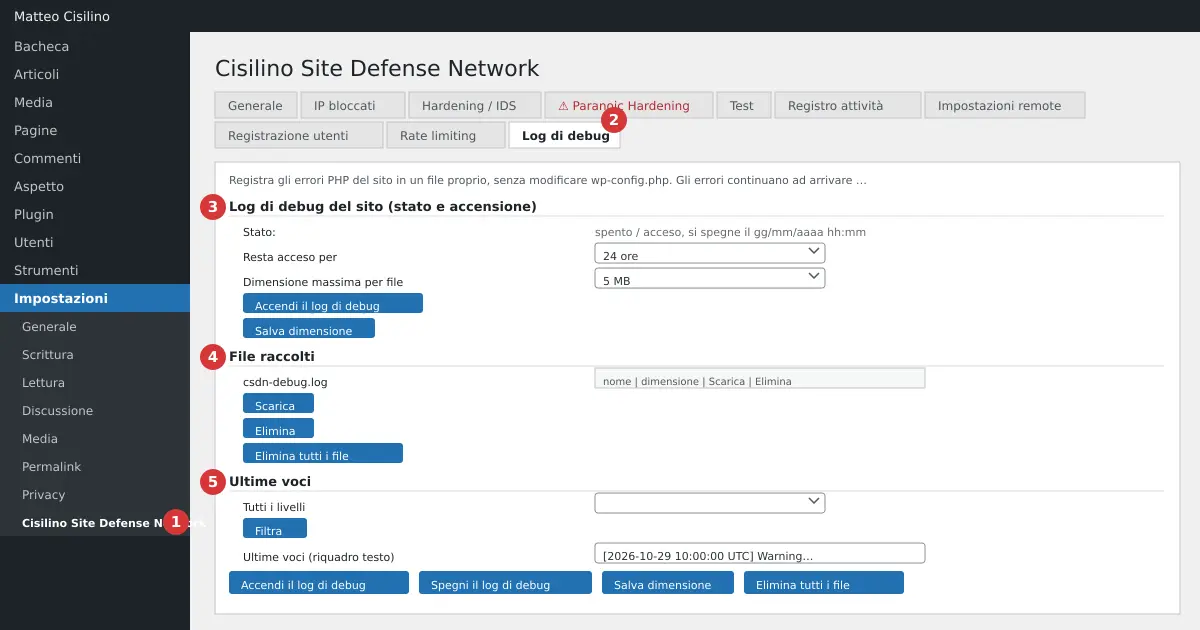
Where it is
Go to Settings > Cisilino Site Defense Network (point 1 in the image) and open the Debug log tab (point 2). There are three sections:
- point 3: “Site debug log”, with status and activation.
- point 4: “Collected files”.
- point 5: “Latest entries”.
What the WordPress debug log is for
It comes in useful when the site shows a blank page or a critical error, when something breaks after an update, or when your hosting won’t let you edit wp-config.php or read the logs. The WP_DEBUG and WP_DEBUG_LOG constants are defined before the plugins load, so a plugin can’t turn them on. This log instead uses a PHP error handler hooked onto the plugin’s own loading.
This log adds to things, it doesn’t replace anything. Errors keep arriving wherever they arrived before, meaning debug.log and the server log. It sends nothing to the panel.
How to use it
- Open the Debug log tab.
- Choose Stay on for: 1 hour, 24 hours (default) or 7 days.
- Choose Maximum size per file.
- Press Turn on the debug log. You’ll read “Debug log turned on. It switches itself off when the chosen time runs out; the files stay.”.
- Reproduce the problem on the site.
- Go back to the tab. Read “Latest entries”, or download the file from the “Collected files” section.
- When you’re done, press Turn off the debug log, or wait for it to expire. You’ll see “Debug log turned off. The files collected are still here below.”.
The “Status:” line tells you whether the log is “on, switches off on dd/mm/yyyy hh:mm”, “off (expired on …)” or “off”. While the log is on you can change the size with Save size.
Collected files
The table lists name, size, and the Download and Delete buttons. Below you’ll find Delete all files. Before deleting, the plugin asks for confirmation: “Delete this file? This cannot be undone.”. For Delete all files the text is “Delete all debug log files? This cannot be undone.”. If there’s nothing you’ll read “No files: the log has never been switched on, or it hasn’t logged anything yet.”.
Latest entries
The box shows the 200 most recent entries, newest first. The All levels menu lets you filter by Fatal error, Parse error, Recoverable error, Warning, Notice or Deprecated. Then press Filter. For anything else, download the files. If the filter finds nothing, you’ll read “No entries match this filter.”.
An entry has this shape:
[2026-10-29 10:15:03 UTC] Warning: message in /path/file.php:12 | GET /page
- The time is in UTC, different from the site time shown in the Activity log.
- After the vertical bar you’ll find the method and path of the request, without the query string. From the command line or cron you’ll see “cli/cron”.
- A multi-line message, such as a stack trace, stays a single entry, with the following lines indented.
- The lines “Info: debug log enabled (user N)” and “Info: debug log disabled (user N)” carry no level: a filter hides them.
Default values and limits
- Duration of the WordPress debug log: 1 hour, 24 hours or 7 days. Any other value becomes 24 hours.
- Size per file: 1, 5, 10, 25 or 50 MB. The default is 5 MB. The chosen size is saved when you press Turn on the debug log or Save size. Watch out: Turn off the debug log resets the size to 5 MB, because that form doesn’t include the size menu.
- Overall cap: 200 MB, adding up the
.logand.zipfiles together. - Every message is truncated to 4000 characters.
- It only logs PHP errors: not slow queries, JavaScript errors or HTTP requests.
Examples
- A critical error after a plugin update: turn it on for 1 hour, reload the page, filter “Fatal error”. The entry shows the file and line, for example
/…/plugins/xyz/file.php:210 | GET /shop/. - Occasional warnings: 24 hours, filter on Warning or Deprecated. If the file has been rotated, download the zip.
- A slow site with no clear cause: 7 days with 25 MB files, then look for Notice and Warning entries that keep repeating.
Keep it on for only as long as you need: often 1 hour is enough.
Warning: the debug log files contain server paths and fragments of data. Don’t share them publicly. They stay on disk even after switching off and after uninstalling the plugin, which deletes the options but not the files. Delete them yourself when you’re finished. The overall cap is 200 MB.
Warning: on an nginx server, turning it on can be refused until the server blocks the csdn-debug-* folder. The message is “Debug log not turned on: the files in its folder appear reachable from the internet (probably a server with no .htaccess support, such as nginx). The logs can contain paths and data: block access to the csdn-debug-* folder in the server configuration and try again.”. If you don’t manage the server yourself, ask whoever does.
Warning: the log doesn’t see errors suppressed with @, nor ones generated before the plugin loads. For example, it doesn’t see errors from wp-config.php. The plugin’s WordPress debug log doesn’t replace the server’s own logs.
What happens behind the scenes
The WordPress debug log saves its files in a folder named wp-content/uploads/csdn-debug- followed by 16 random characters. Inside are an index.php, a .htaccess denying access, and the file in use, csdn-debug.log. On activation the plugin writes a test file and tries to read it over HTTP. If it responds, the plugin refuses to turn the log on.
When the file in use exceeds the chosen size, it is closed, compressed into a .zip, and a new one starts. No entry is lost. The original .log is only deleted once the zip has been verified. If the compression fails, the .log stays. “Latest entries” only reads from the file in use, so after a rotation the older entries sit inside the zip files.
Before rotating, the plugin checks the 200 MB cap. If it’s reached, the log stops so nothing gets overwritten. The yellow notice reads: “The log has stopped because the files reached the space cap (200 MB): to avoid overwriting data, it stops writing. Download or delete the files, then turn it back on.”. To start again, delete the files and turn the log back on.
On expiry the log switches itself off, but the files stay. The plugin never truncates or deletes them: only you do that, with Delete or Delete all files. For fatal errors, the entry is written at the end of the request.
If the WordPress debug log doesn’t work
- “Debug log not turned on: the uploads folder is not writable.”: check the permissions on the
wp-content/uploadsfolder. - The log doesn’t write: if writing fails, the plugin reports it with an entry “Site debug log: …” in the “Last attempts” of the Activity log tab.
- The log has stopped for the cap: download what you need, delete the files, and turn it back on.
The general guide to the manual explains where this tab fits in. To understand the WordPress constants better, look at the official WordPress debugging guide: it explains WP_DEBUG and WP_DEBUG_LOG, which this plugin cannot replace.
Previous chapter: Activity log. Next chapter: Troubleshooting and frequently asked questions.


Leave a Reply