The activity log WordPress keeps through the CSDN plugin is a local diary of who did what, and when, on your site. It records logins, users, content, plugins, themes and more. It’s there to help you reconstruct what happened.
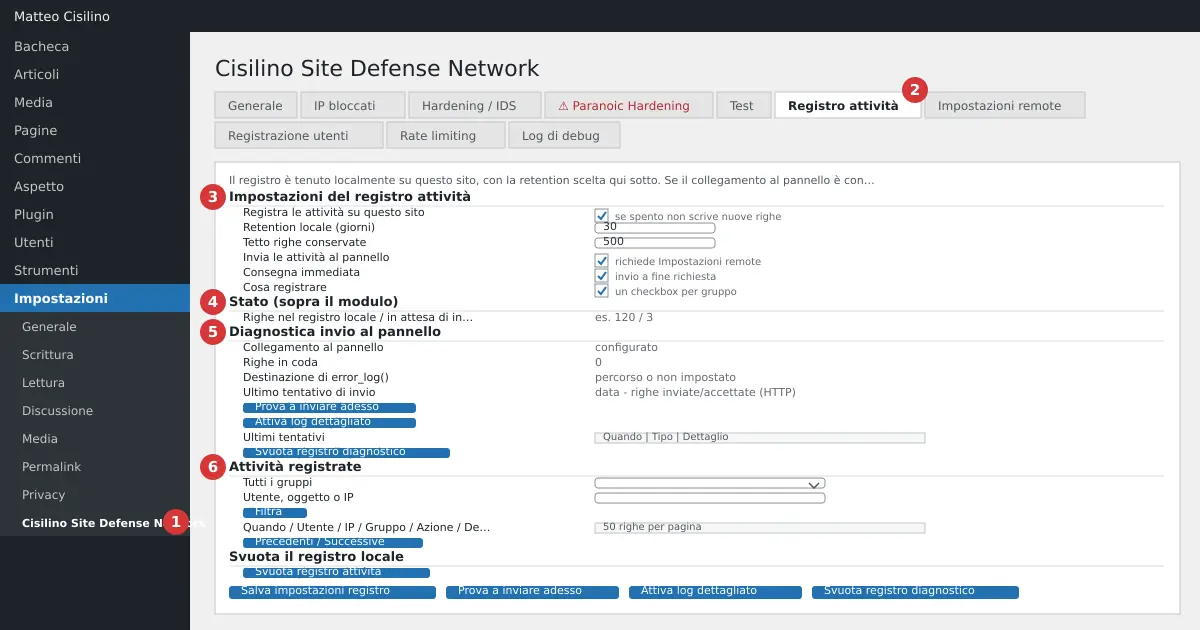
Where it is
In the backend go to Settings > Cisilino Site Defense Network (point 1 in the image). Open the Activity log tab (point 2). From top to bottom you’ll find these sections:
- point 3: “Activity log settings”.
- point 4: the status row above the form, with the row counters.
- point 5: “Panel delivery diagnostics”.
- point 6: “Logged activity”, the table with the filters.
- point 7: “Clear the local log”.
What the activity log WordPress keeps is for
It helps you answer questions like “who deactivated that plugin?” or “which IP did that user log in from?”. Every event is a row in the site’s database table.
Don’t confuse it with the per-IP failed-login counter, which decides the blocks. They are two separate pieces of data, with different retention rules. A failed login attempt, though, also shows up here, one row per attempt.
For a long history and for serious searches, the panel is better. The local log also works without the panel. The connection is set up in Remote settings.
How to use it
- Open the tab and look at the row “Rows in the local log: N — awaiting delivery to the panel: M”.
- In the form, choose the settings described below.
- Press Save log settings. You’ll see “Activity log settings saved.”.
- To read the events go to “Logged activity”. Choose a group from the All groups menu, or type into the User, object or IP field, then press Filter.
The form settings
- “Log activity on this site”: turn it off and no new rows are written. Old ones stay.
- “Local retention (days)”: from 0 to 3650. With 0, nothing is deleted for age.
- “Rows kept cap”: from 0 to 1,000,000. With 0 there’s no cap.
- “Send activity to the panel”: requires the connection set up in Remote settings.
- “Immediate delivery”: sending starts at the end of the request, without making the visitor wait. Turn it off, and sending happens only with the 15-minute synchronisation.
- “What to log”: one box for each of the 18 event groups.
The event groups
The groups carry these labels, identical in the “What to log” boxes and in the All groups menu: Logins (login, logout, failed attempts); Users (creation, profile edits, roles, deletion); Content (posts, pages, custom post types); Categories and tags; Comments; Media (attachments); Plugins (activation, deactivation, installation, update); Themes (theme switch, update, customisation); WordPress updates; WordPress settings; Navigation menus; Widgets; Theme/plugin file editor from wp-admin; Content export; File uploads (including those outside the media library); Plugin file integrity; Plugin settings (including this plugin’s own); Plugin lifecycle (deactivation, uninstallation, log clearing).
For WordPress settings only a selection of the main options is logged, for example blogname, siteurl, admin_email, default_role and active_plugins. For other plugins, only settings declared with register_setting() or saved through options.php are visible. The file editor logs the attempt, not the outcome.
How to read the table
The columns are When, User, IP, Group, Action, Detail and Sent. There are 50 rows per page, most recent first. Use Previous and Next to move around. If there’s nothing, you’ll read “No activity recorded (with these filters).”.
Group and Action appear with their raw name, for example plugins and deactivated. Anyone not logged in shows as “(not authenticated)”. In the Sent column you’ll find the panel’s confirmation date, or “—” if the row is still queued. The technical details field isn’t visible here: it’s read on the panel.
An example row: 12/10/2026 09:14:02, user mario (administrator), IP 203.0.113.5, group plugins, action deactivated.
Examples of reading it
- The “Logins (login, logout, failed attempts)” group and a suspicious IP: a run of
failedfollowed by asuccesscan mean someone has guessed the password. - A
usersrow with actionrole_changedand an unexpected user: check whether it’s a privilege escalation. - A row in the Uploads group with a block warning: someone tried to upload a dangerous file.
Default values for the activity log WordPress keeps
- Logging on, sending to the panel on, immediate delivery on, every group active.
- Retention: 30 days. The age-based deletion runs once a day.
- Row cap: 500. The check runs every 100 inserts, so the table can exceed it by about 100 rows.
- If you save with no group ticked, the log stays on but writes nothing.
- It doesn’t log normal visits, and it doesn’t export data.
Warning: a failed login saves the username typed. If someone types their password into the username field, that text stays in the log, which can go to the panel. The plugin doesn’t filter it out. Keep this in mind when you share or read the log.
Warning: the row cap (default 500) deletes the oldest rows even if they haven’t been sent to the panel yet. The cap takes priority over the delivery guarantee. On sites with a lot of unauthenticated traffic (failed logins, comments, file submissions), 500 rows can run out quickly. If you need the full history, raise the cap, but bear in mind that setting it to 0 removes the limit on disk space.
Warning: “Clear activity log” is irreversible locally. It first asks for confirmation: “Clear the whole local activity log? This cannot be undone.”.
What isn’t saved
Plain-text passwords are never logged. When a profile is edited, only the fact that the password changed is saved. The plugin’s “API Key” field is shown as ***. Options from other plugins whose name contains words like key, secret, token, password, auth, salt, nonce, license or credential have their value replaced with “*** (value not logged)”. Option values are truncated to 200 characters.
Panel delivery diagnostics
The section at point 5 is useful when activity isn’t reaching the panel. A failed send shows no visible error: the rows stay queued and retry. The only symptom is the “awaiting” counter that doesn’t drop.
The table shows, among other things, “Panel connection”, “Activity log”, “Sending to the panel”, “Immediate delivery”, “Rows queued”, “error_log() destination” and “Last send attempt”. Problem values are in red. If the last attempt shows fewer rows accepted than sent, you’ll see “Rows rejected by the panel”: those rows aren’t retried.
There are three buttons:
- Try sending now: makes a test send immediately. The result appears in the table.
- Enable detailed logging (then Disable detailed logging): also logs successful sends.
- Clear diagnostic log: clears only the “Last attempts” list, which holds at most 25 entries. It only appears if there are entries.
What happens behind the scenes
At the end of the request the plugin closes the response to the visitor, where the server allows it, and sends the rows to the panel in batches of at most 200, oldest first. A row counts as delivered only once the panel confirms receiving it. A synchronisation every 15 minutes acts as a safety net.
Age-based retention deletes old rows once a day. If sending is on and the panel is configured, it only deletes rows already confirmed. Otherwise it deletes purely by age.
Clearing the log first tries to send the backlog, then deletes everything. It logs the clearing event, which becomes the first row of the new log. It sends no delete command to the panel: the history already sent stays there. After clearing you’ll read “Local activity log cleared. History already sent to the panel was not touched.”. If there were rows never delivered, a bold warning tells you how many were lost.
If the activity log WordPress keeps won’t send
- The “awaiting” counter doesn’t drop: open the diagnostics, check the last attempt and the HTTP code, then press “Try sending now”.
- A yellow box on the panel that doesn’t confirm: the panel may be out of date. The rows stay queued and nothing is lost.
- Connection “NOT configured”: without a customer code, API key and URL nothing is sent. Go back to Remote settings.
For a wider guide to good logging practice, read the OWASP logging guide: it explains what’s worth logging and what to avoid.
Back to chapter 1, the index of the manual. Previous chapter: Rate limiting. Next chapter: Debug log.


Leave a Reply